

AA County SBHC Needs Assessment
Background
The Hilltop Institute was contracted by the Anne Arundel County Department of Health to help determine whether there is a need for a school-based health center (SBHC) in Anne Arundel County and —if so— potential locations for the SBHC. This needs assessment included a gap analysis to explore the availability of health services providers across the county, the results of which are presented here as a series of maps.
Map Instructions
This site has three interactive maps containing all the data used for the health services gap analysis. More detailed information about the data can be found in the “Data Sources” section at the bottom of this page. Each map can be viewed by selecting one of the three tabs located just above the map viewing area. Selecting a different map will not reset the map previously being viewed.
Though the information presented varies with each map, the basic functionality and layout is the same for all of them, as shown in the image below:
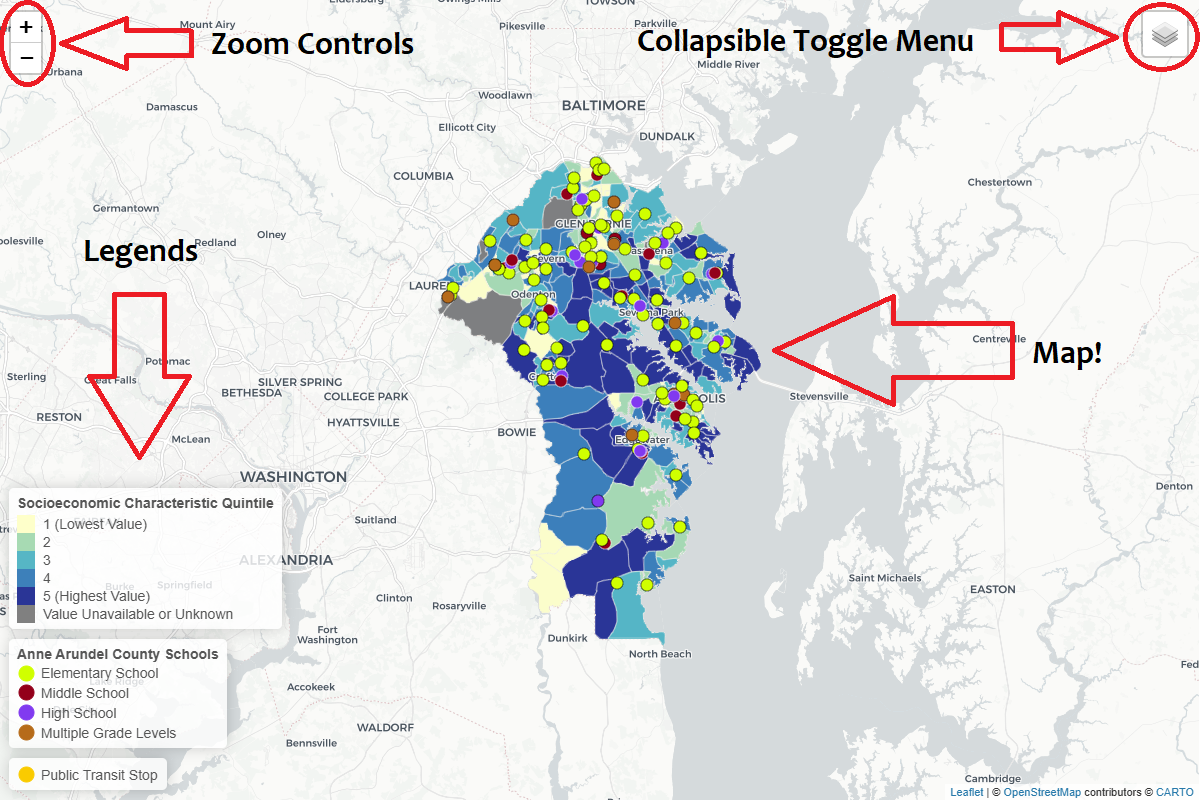
Hovering your mouse over the small square in the top right of the map will open the toggle menu. This menu shows every layer of the map, and clicking the small check box next to a layer’s name will display it on the map. Note that the layering hierarchy is such that locations, represented by small colored circles, will always appear as the top layer(s) when selected. Clicking the plus and minus sign in the top left will zoom in and out of the map. You can also zoom in and out using your mouse’s scroll wheel. The legends in the bottom left will contain different information depending on which of the three maps you are viewing, but they will always be in the bottom left and will always describe all of a map’s layers, not just the ones currently displayed.
Moving your mouse across the map and the locations on it will cause them to be highlighted, and clicking on whatever is highlighted will activate a small pop-up window containing information about the selection (only the locations will be highlighted in the Provider Catchment Areas map, though clicking on the map will produce a pop-up window). Pop-up windows can be closed by either clicking the small “X” in the top-right corner of the pop-up or by clicking elsewhere on the map. Some of these pop-ups contain a lot of information; a scroll bar on the right side of the pop-up indicates that more can be seen by scrolling down while hovering your mouse over the pop-up.
Map Descriptions
Each map is described below and can be accessed by clicking the tab with the corresponding title:
Socioeconomic Characteristics: Shows each census block group in Anne Arundel County categorized according to its quintile rank for various socioeconomic characteristics. Clicking a block group displays a pop-up window containing details on these characteristics. This map also shows the locations of Anne Arundel County schools, categorized by grade level, with a separate category for schools at 70% capacity or less, as well as public transit stop locations. Clicking a school displays a pop-up window with different educational and enrollment metrics, and the name of and time it takes to walk to the nearest public transit stop. Clicking a public transit stop displays the stop’s name. If multiple block group layers are selected in the toggle menu, the one toggled on most recently is the one that will be displayed, and this top layer will fully obscure all other selected layers.
Provider Density Cluster Analyses: Shows which parts of the county were identified as having clusters of census block groups with high or low provider density values, with density defined here as the number of providers per 1,000 block group population. Locations of providers categorized by self-reported specialty can be toggled on and off, though cluster analyses were only performed on primary care providers (PCPs), physician assistants and nurse practitioners (PAs/NPs), PCPs and PAs/NPs combined, and all provider types combined. School and public transit stop locations are also included. If multiple block group layers are selected in the toggle menu, the one toggled on most recently is the one that will be displayed, and this top layer will fully obscure all other selected layers.
Provider Catchment Areas: Shows the 5-, 10-, and 20-minute catchment areas of numerous provider type in Anne Arundel County (does not include providers categorized as “Other Specialty”). The three catchment areas are presented separately for each provider type and can be toggled on and off as desired using the dropdown menu in the top right (e.g., the 5-minute and 10-minute catchment areas for PCPs are distinct layers and can be displayed together or individually). This map also has provider locations, school locations, and public transit stops. Regardless of provider type, the 5-minute layers will always be displayed on top of the 10- and 20-minute layers, and the 10-minute layers will always be displayed on top of the 20-minute layers.
Data Sources
All data used for these maps are available for free to the public, with a slight exception for some of the provider data: some provider information was obtained through a restricted-access system, and the Needs Assessment Steering Committee overseeing this work provided a list of providers, though none of it is considered private or sensitive. School and provider addresses were geocoded using the Microsoft Bing Maps Application Programming Interface (API) and ArcGIS Pro (version 3.2) to find locations. Data processing was done in SAS (version 9.4) and RStudio (version 4.4.2 patched). The interactive maps were made in RStudio using the Leaflet package (version 2.2.2). All data sources are listed below:
1. Anne Arundel County Public Transit Stops: Anne Arundel County OpenData
2. Area Deprivation Index: University of Wisconsin School of Medicine and Public Health. (2025). Area Deprivation Index, 2022 Version.
3. Block Group-Level Socioeconomic Characteristics: IPUMS NHGIS, University of Minnesota. (2025). American Community Survey 5-year Estimates, 2019-2023.
4. Population Density: Schiavina M., Freire S., Carioli A., MacManus K. (2023). GHS-POP R2023A - GHS population grid multitemporal (1975-2030). European Commission, Joint Research Centre (JRC)
5. Provider Information: Maryland Board of Physicians. (2025). Public Information Act Requests – Rosters and Lists.
6. Additional provider rosters obtained from the Medicaid Management Information System and the Anne Arundel County Department of Health.
7. School Information: Maryland State Department of Education. (2024). Public use data for download.